Lewis Diagrams
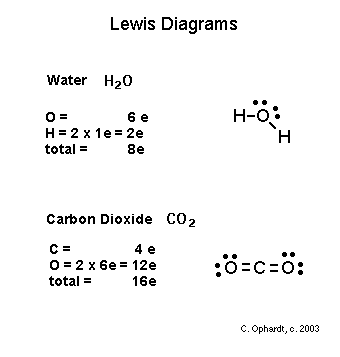 Lewis diagram for carbon dioxide.
Lewis Diagrams are a tool used by chemists and chemistry students to show a visual representation of a chemical reaction. Lewis Diagrams use Lewis Symbols to represent the various elements in a compound or reaction. Lewis Symbols are drawn using the element's symbol (such as O for oxygen) and dots around the symbol representing the valence electrons. Lewis Diagrams make finding the possible combinations for a reaction much simpler. They are sometimes called electron dot diagrams or structures.
Showing Covalent Bonds with Lewis Diagrams
In a covalent bond, electrons are shared between the elements. This is shown on a Lewis Diagram by pairing the two elements and circling the shared pairs of electrons.
For example, when hydrogen bonds with any other atom, its valence electron is shared with the recipient atom. The two atom's symbols are drawn next to each other, and the shared pare of electrons is circled. Covalent bonds drawn with Lewis Diagrams can become quite large and complex. The system gives scientists a visualization of how the compound comes together.
Showing Ionic Bonds with Lewis Diagrams
Ionic bonds can also be drawn with Lewis structures. Instead of placing the two elements close to each other and circling the shared bond, as is done when drawing covalent bonds, ionic bonds are indicated by the charge each atom has after gaining or losing an electron.
For instance, when bonding lithium and fluorine to make lithium fluoride, the lithium must lose its valence electron to the fluorine. The two are drawn next to each other. The fluorine has a full set of electrons, one coming from the lithium, and the lithium now has none. The lithium is drawn with a positive charge and the fluorine is drawn with a negative charge.